Artificial Intelligence (AI) algorithms can be used to optimize food and beverage manufacturing supply chains, helping companies anticipate market changes. This information allows manufacturers to optimize staffing, inventory control, energy consumption, waste reduction, food safety and the supply of raw materials.
According to Business Wire, artificial intelligence in the food and beverage market was valued at US $3.07 billion in 2020 and is expected to reach $29.94 billion by 2026, at a CAGR of over 45.77% during the forecast period 2021-2026.
AI is hitting new adoption levels each year, with supply chain management in logistics taking center stage. Companies are increasingly testing the technology in logistics to improve on the last-mile delivery, reduce the time to go to market, and provide for the required customization to customers.
An overview
McKinsey & Company guides global manufacturing and supply chain clients through the design and implementation of operational strategies, creating agility and a product portfolio that is both commercially and operationally optimized. We looked to Curt Mueller, senior partner at McKinsey & Company based in Chicago, for a snapshot of AI use in manufacturing.
“The COVID-19 pandemic has sharpened the need to adapt operations as consumers reshape their consumption patterns, with lingering uncertainty about the long-term effects of the crisis,” Mueller says. “For example, planning for swings in supply and demand, and scheduling shipments have become much bigger challenges for food and beverage manufacturers. Traditional forecasting algorithms are no longer sufficiently flexible for the rapidly changing levels of demand and supply.”
Mueller explains how artificial intelligence is changing the way companies plan, schedule and operate their supply chains in three ways:
• Planning – “We are seeing more and more companies use AI and machine learning to plan their supply chains. We used to see many interventions and the use of judgment in planning, next came analytics where complex algorithms were developed. Now we are entering into a new phase where the machine does the planning and removes most, if not all, of the human touch or intuition.”
• Manufacturing – “AI has exploded recently in manufacturing and will continue to grow at a substantial pace. Technology is now at an affordable threshold that companies large and small can benefit from greater AI with automation, preventative maintenance, center-lining, as a few examples.”
• Logistics – “Digital twins are changing the way logistics and warehousing work today. AI-powered digital twins show companies how best to plan, pick and ship their warehouses. Here is where AI and the physical world are colliding to make tremendous step changes in productivity.”
There is more data available than ever before, and Mueller says that it is no longer enough for food and beverage manufacturers to monitor structured transactional and supply chain data. For example, retailers can help their suppliers by capturing the millions of daily events and interactions, and analyze the data to make data-based decisions to adjust to supply and demand, and optimize experience and productivity.
However, Mueller believes that AI only can help with the designed parameters and only how good the humans are in implementing AI. And, that it’s crucial for executives to build organizations around “products” (such as customer care or warehouse management) and not focus solely on applications.
“You can argue that AI, at its current level of maturity, would have been very difficult to not only predict but also react to the massive shocks we saw with COVID. I am confident that we will learn more and AI will be one important tool to governing supply risks in the future” he says.
Kristen Kazarian, managing editor
Experts believe that food and beverage manufacturers will need artificial intelligence in their business model to survive in the future
Artificial intelligence can help processors with their supply chain, logistics and food safety. Photo courtesy of Getty Images / Imaginima
New technologies in this space are providing unprecedented flexibility to rapidly aggregate, process and analyze the volume data, which gives companies the ability to adapt, such as identifying new suppliers quickly, at the same rapid pace of supply and demand shifts.
The most successful new technology solutions follow a modular approach that is consistent and reusable across channels. This approach requires breaking down monolithic legacy architectures into smaller, self-sufficient services—meaning they can be enhanced and deployed independently from other parts of the architecture.
Here, we feature two companies from different vantage points—one at the processor level and one at the CPG level. As well, a case study for each with one of their customers.

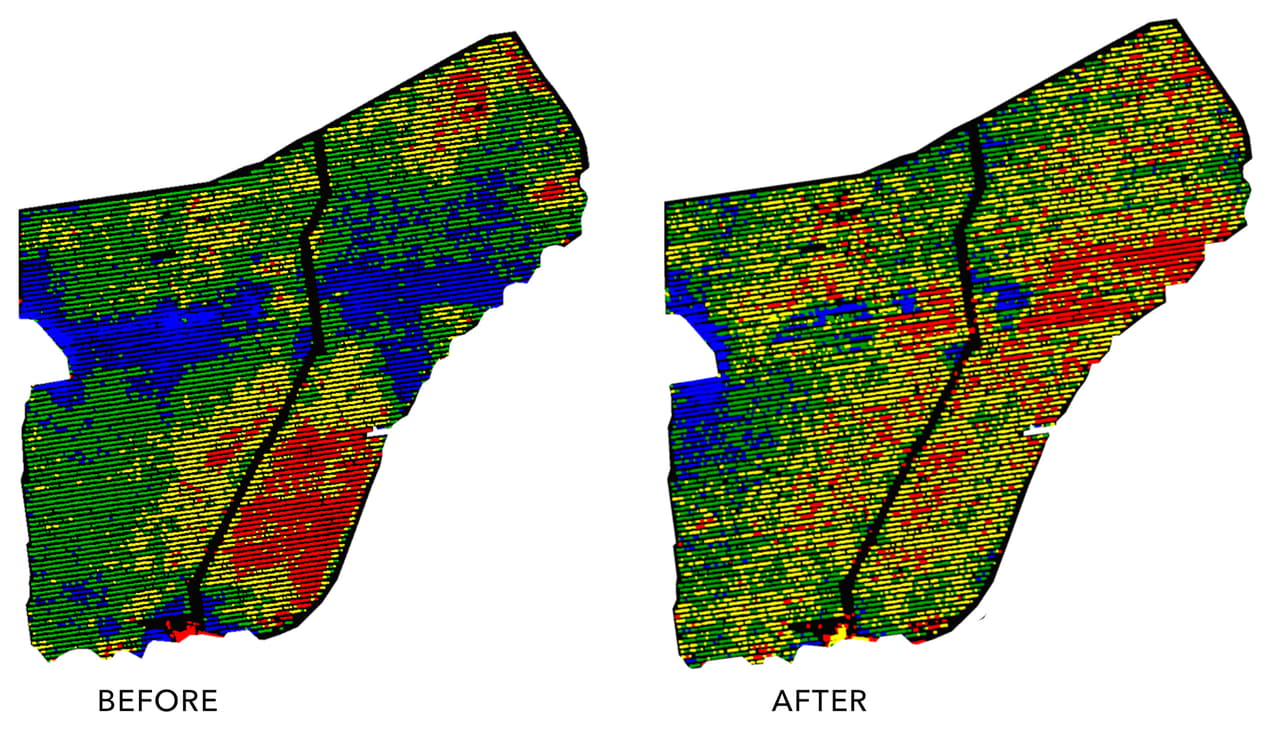
In this California vineyard, water stress imagery revealed an underground river running through the middle of the ranch, visible as the large band of blue. With help from Ceres Imaging, the irrigation program was adjusted to improve grape quality, seen in the second image. Photos courtesy of Ceres Imaging
Ceres Imaging is an agronomic set of tools that processors benefit from at the farm level. At its basic level, it performs irrigation analytics. The tools focus on the crop and not the soil.
Currently, processors are using AI to improve quality of their product. “We are especially seeing that in the wine grape space,” says John Bourne, vice president of Ceres Imaging. It’s also being used to improve yield, which the company is seeing in potato processing.
Processors use Ceres tools for yield forecasting and transparency on the growing side of the supply chain.
Ceres
Ceres Imaging is based in Oakland, Calif., with offices in Omaha and Bellevue, Wash. It is a venture-backed company delivering irrigation management solutions that help growers detect acute issues, track and measure progress, and improve farm performance. Ceres serves growers across Australia and the United States.

John Bourne, vice president of Ceres Imaging
At the processor level
Cumulative Stress
The Cumulative Stress product has helped tree nut processors forecast yield. Crop stress is based on research performed with University of California—Davis. “We look at the relationship between in-season crop stress and yield. The data from our tool basically shoots out a number of how the crop stress is impacting the yield in a certain block or a whole region” Bourne explains.
The tool is a software platform that growers access via phone or computer. It is basically imagery with different layers that tell the user different things, like product insights and information. So, the combination of layers can come up what the cumulative stress level is.
Uniformity
Other tools which growers care a lot about are uniformity tools. Uniformity of the plant matters as it is tied to yield. And in general, better uniformity offers better yield. So it’s another yield management tool but from a different perspective; it is less yield forecasting and more yield management. This is called a uniformity score.
Uniformity of the plant, which is really critical because things like non-sufficient water levels or pests and diseases can impact that uniformity and you want a very high uniformity to have a high yield. You want to harvest at the right time, etc.
Water Stress Index
The Water Stress Index identifies issues at the grower level around their irrigation process. This is very important because growers like wine brands equate water stress with wine quality, for example.
“We use AI to segment out the soil and just read the crop. That’s how we create really accurate analyses.”
— John Bourne, vice president, Ceres Imaging
Ceres uses convolutional neural networks (a type of AI) to classify individual plants, so it looks at the pixel and knows not to read ground cover, soil, etc. and to read only the individual plants. The interface turns actionable for growers where it’s across many dimensions—vigor, water stress, etc.—and you can look at the status of every plant in your operation. Users can ladder up and see how many trees or vines were at this level last week and how many at the same level this week. They can also filter out dimensions and just look at highly stressed or low vigor crops or sections.
“We use AI to segment out the soil and just read the crop. That’s how we create really accurate analyses,” explains Bourne. One of the inputs in the water stress index, for example, is heat, known as thermal energy. The Ceres tool measures the crop temperature as one of the data inputs into the data index. And thermal is extremely important for water stress management, adds Bourne.
In addition to the three named above, Ceres Imaging also offers additional tools including these:
• NDVI – (Normalized, differentiated vegetative index), which measures the vigor of the plant.
• Seasonal Trends – Allows you to look at these different indexes over time. You can make assessments and see how seasons are trending and processors like it, because it gives it another insight into their farm portfolio.
Today, processors are using AI for control around yield and quality in their supply chain. And use cases are different for every crop, Bourne says.
“I think the place we are going to see it more, in say five years from now, is on the sustainability and ESG (Environmental, Social and Governance) side, such as transparency in their supply chain,” he adds.
There is a lot of good data processors can report on to tell their story of improved water use efficiency and improved nutrient use efficiency. It is general transparency in their supply chain that they could benefit from. “We don’t see too many doing that right now, but we think it’s going to be a really important way this product is going to be used by processors,” says Bourne.
There is so much data available now through retailers to manufacturers, and yet these manufacturers are sometimes not capable of making good use of that data. “Or, with the existing processes they have set up—as some retailers are decades old—have operated based on sell-in data. They base a lot of their decision-making, planning and production plans off of the back of orders coming from retailers,” says Chi-Chi Liang, EVP, marketing, Alloy.
Alloy
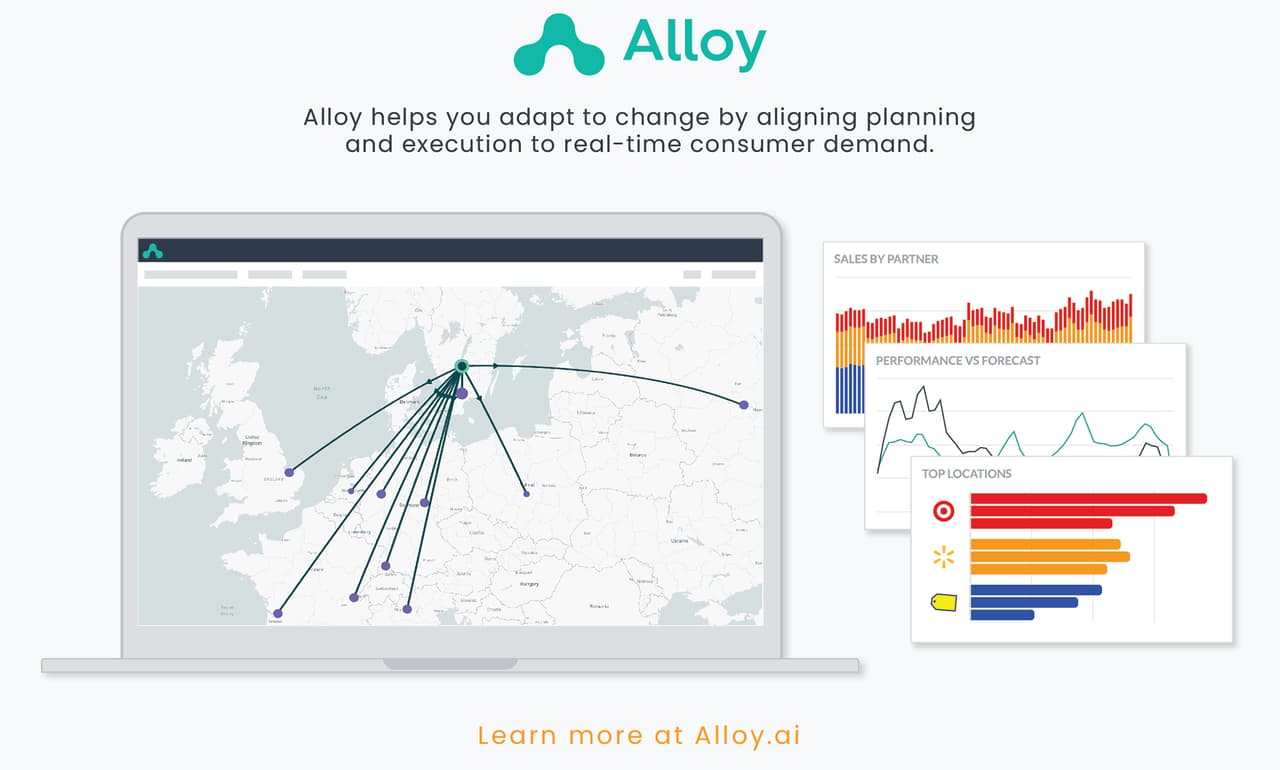
Alloy was founded 2017. Based in San Francisco with offices in Berlin, Germany, and Vancouver, British Columbia, it is a digital-native company built for an era where consumer demand is regularly shifting and changing. Alloy aims to equip brands with a modern technology platform that helps ensure products are available where and when consumers want them.

Chi-Chi Liang, EVP, Marketing at Alloy
At the CPG level
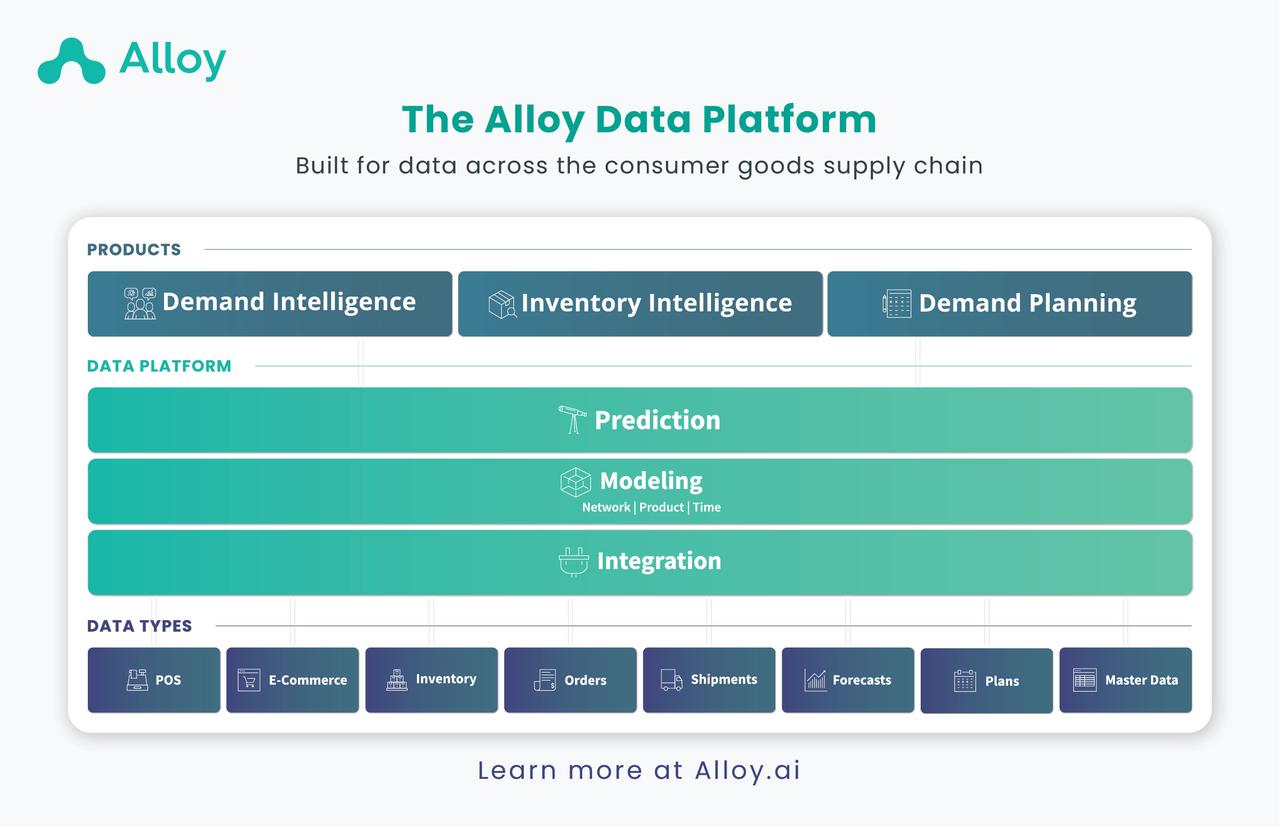
Alloy offers three AI solutions for sales analytics, inventory management and demand planning. Image courtesy of Alloy
Over the last decade or so, that data has been made increasingly available by Walmart and large retailers because they can’t keep up. These retailers need their vendors and manufacturers to make use of that data and make recommendations. “The reality is that’s not really happening in many cases. That’s where Alloy comes in,” says Liang.
Alloy’s expertise lies in ingesting a ton of data across hundreds of retailers, e-commerce sites and the like, and harmonizing and making sense of that data. The company focuses primarily on consumer goods companies. Their customers have end consumers that they reach through either direct-to-consumer or retailer channels. That mix of different channels for which they reach their consumers is where Alloy provides help.
The tools connect the demand signal up through the customer’s internal inventory, plans and forecasts to make sure they’re planning as accurately as possible and when the plan doesn’t match reality 100%, providing them with analytics and intelligence so they’re making the right decisions on how to reallocate inventory to the right places, decide whether they need to ramp up production, or in some cases to figure out a waste problem.
Alloy offers three AI solutions for sales analytics, inventory management and demand planning:
Demand Intelligence—A point-of-sales and inventory analytics solution. It identifies sales opportunities and inventory risks in a retail network, giving shareable insights to drive action from a company’s customers and achieve sales goals. Alloy ingests and harmonizes the granular POS data across retailers so that customers can easily drill up or down from a regional to retailer to an individual store level to see where inventory should go..
Inventory Intelligence—A predictive control tower which simulates value at risk across the supply chain network, enabling customers to anticipate, diagnose and respond to critical issues as early as possible. Inventory Intelligence marries granular POS demand data with ERP data to help consumer goods companies understand where they may be hurting across their network. AI comes into play here, providing simulated weeks of supply and out-of-stocks based on the demand signal.
Demand Planning—A POS-driven forecasting and planning solution that generates forecasts based on harmonized POS and shipment data, and translates them into an optimal cross-retailer shipment plan based on your data inputs. Customers add this on top of the Demand Intelligence layer for a more accurate Demand Planning process.
All three are not required to work, but Alloy recommends using all three for a more robust solution.
“We start by understanding the true demand signal and then connect that signal to their ERP data so the client understands where their inventory resides within their partners or internal networks relative to current consumer demand.”
— Chi-Chi Liang, EVP, Marketing at Alloy
Automate to accelerate
Liang says that they see a lot of customers trying to jump into AI without fully grasping all that needs to happen first in terms of getting a clean data asset. “We start by understanding the true demand signal and then connect that signal to their ERP data so the client understands where their inventory resides within their partners or internal networks relative to current consumer demand—as well as understanding and comparing against numerous versions of plans such as retailer plans and sales forecast plans and being able to see what their plan says relative to what the demand signal is showing,” she says. The customer can then see which adjustments need to be made across those various plans.
Liang believes that AI in the future will be connected over time, by extending up to the raw material suppliers. And if you’re not ready, you can piece off one part of it at a time, instead of biting off more than you can chew.
But know that if you’re not approaching it in a thoughtful, methodical way upfront, you can make your life challenging. If you’re automating imperfection, with embedded mistakes or process breakdowns etc.—it could do the opposite of what you need it to do. If you have a good foundation, there is a lot of benefit. If you don’t, you could end up in a worse situation than what you were previously.
In August 2020, Ferrero USA and Alloy struck up a partnership … in the middle of the COVID-19 pandemic. Ferrero had a waste problem. Here, Glenn Lawse, VP of Supply Chain at Ferrero USA explained how the brand moved forward with AI tools to better manage their supply chain.
Bridging the gap between planning and execution has revolutionized Ferrero’s supply chain. “The reality is, even outside the pandemic… we don’t always get information fast enough to have visibility to make the right decisions. We have a lot of partners we work with… they all have their own bits and pieces of information, and trying to make sure you make the best decision with all that information is very hard to achieve,” said Lawse.
Supply chain data comes from numerous sources and in varying formats, both internal (including ERP, consensus demand plan and business intelligence) and external (including planning from each of your distributors and retailers, POS data and other partner-specific spreadsheets). Without a digital supply chain, manually matching up the different product identifiers and compiling the reports together to understand what’s happening can’t happen quickly enough to be helpful.
“Typically, you end up firefighting… it becomes inefficient; it’s very frustrating,” Lawse said. But things changed when Ferrero USA partnered with Alloy to help connect the dots.
As they introduced a new product to the U.S. in 2019, Lawse had to make a decision about whether to increase production. It was manufactured in Italy, so if the right action wasn’t taken in time, Ferrero could be facing unfulfilled orders and out-of-stocks or expensive expedited shipping.
Ferrero: Sweet Results