Automation
After years of mergers and acquisitions, large food and beverage companies seek operational data visibility across multiple plants to drive efficiencies.
to Find Data Visibility Across Multiple Sites
Enterprises’ Quest
Chocolate producer Barry Callebaut AG produces more than 2.2 million tons of confectionery annually, while Carlsberg Group, a global brewer, has 78 facilities. During the last ten years, large food and beverage operations have been under pressure to improve yields as lighter system software platforms and practical industrial networking solutions have made data visibility economical.
FOOD ENGINEERING’s 2023 State of Food Manufacturing report backs this up. With a 50% or better response, respondents said these productivity-related improvements were of “great-need” or “some need”: equipment upgrades, improved engineering/IT communication, improved supply chain management, improved reporting of overall equipment effectiveness (OEE) and process control/platform upgrades.
After some initial challenges, Barry Callebaut identified a modular approach for its MES platform while emphasizing a value-driven process across its 41 production factories. Image from Freepik
by Grant Gerke
The question for many supermajors in the food and beverage industry is what system software technology or platform is the next step, and, of course, deploying to plants at scale. Companies have identified manufacturing execution systems (MES) that can be enabled via industrial networking protocols like OPC UA, which feeds disparate devices and programmable logic controls (PLCs) data to Level 4 business platforms and dashboard displays to operators on the plant floor.
“Within the fast-moving consumer goods (FMCG) sector, many disparate systems exist across various aspects of production; this can vary from OEM-produced assets, such as ovens, to energy systems for a site,” says Paul Brooks, Digital Transformation Specialist at PTC. “For a more holistic view of factory metrics, the aggregation of data from production, quality, maintenance and inventory is required to gain real-time production performance insight.”

Productivity improvements are top drivers for food and beverage companies, and common platforms can help drive production volume and operational efficiencies without adding new lines.
According to the World Economic Forum, smart manufacturing could lead to a 20% reduction in production costs and enhance efficiency by 25%, and data visibility across the enterprise is essential. In 2017, legendary director of engineering of global reliability at General Mills, Jim Wetzel, talked about smart manufacturing’s potential and the need for operational efficiencies.
At the 2017 ARC Forum show, Wetzel cited a yogurt production line at 30% capacity. “Our entire network at General Mills creates 700 billion data points a day, and no one at the factory was looking at the PLC information at this one plant,” says Wetzel. “By analyzing that specific line data and understanding in milliseconds the responses of servos and motors, we were able to troubleshoot this line from an engineering perspective.”
Barry Callebaut’s Bram Van Genabet, corporate digital innovation manager, discussed a similar data challenge for the Swiss-Belgian company at the AVEVA World 2022 conference. A global leader in producing chocolate and cocoa, the company adopted AVEVA Group’s MES platform and embarked on a smart manufacturing journey for its 41 production factories across the globe.
With this move, the global chocolate producer moved away from paper-based reporting, and Van Genabet talked about the challenges in adopting a common digital platform across multiple plants. “We had huge expectations because we defined that we wanted to fully digitally transform our operations, interconnect our ERP system entirely to the shop floor and go paperless,” says Van Genabet.
The project’s overall manufacturing goals included improving traceability, quality, performance, dosing, accuracy and reducing energy consumption. For the chocolate maker, AVEVA’s MES suite offered multiple modules: inventory, production, quality, traceability, performance and scheduling.
“At the end of the day, digitizing manufacturing is about delivering value. It’s not about applying technology to manufacturing,” says Sheetal Jain, MES practice leader for the consumer products industry at AVEVA. “Technology is just an enabler to deliver value to manufacturing, and you have to have a solid plan for mitigating bottlenecks along the way.”
However, to enable this technology, the chocolate manufacturer had to adopt a strategy to roll out the MES platform across the enterprise and understand the digitization challenges, such as heterogeneous industrial networks across plants, assimilating data from multiple PLC vendors, workforce technology maturity and user experience on the plant floor.
“We had huge expectations because we defined that we wanted to fully digitally transform our operations, interconnect our ERP system entirely to the shop floor and go paperless.” — Bram Van Genabet, Corporate Digital Innovation Manager, Barry Callebaut
With such a large effort in front of Barry Callebaut, the company used a “common vs. unique” approach to identify initial plant rollouts. These four factors included “common differences” across plants and how these attributes make the plants unique: work process-related, equipment and automation-related, workforce-related and metrics-related (see sidebar).
One of the key pillars to moving forward included putting value at the center of the rollout. “Not having a standardized data collection system and an environment with many different types of PLCs, some very old, regional differences had to be accounted for,” says Van Genabet.
AVEVA’s MES historians allowed Barry Callebaut to connect to Siemens and Rockwell Automation PLC data and display it to process engineers. “Since we didn't have any prior installed base that was of substantial scale yet, it allowed us to standardize building models of our assets, which we did in the first phase of the project,” says Van Genabet.
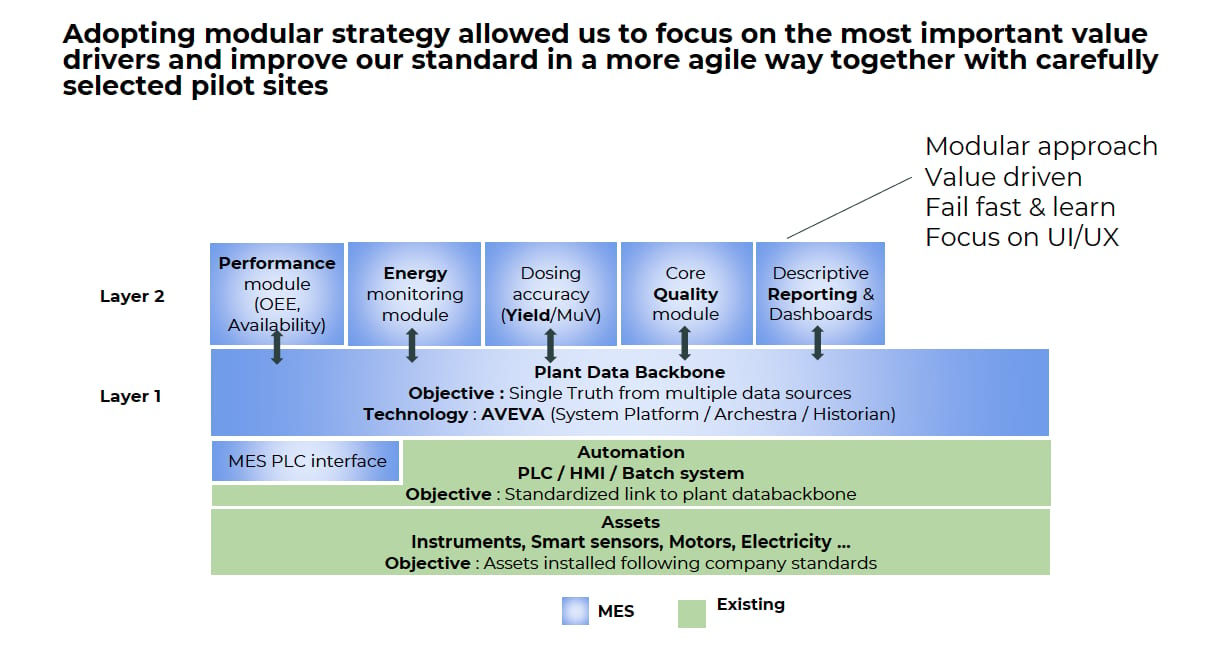
With a data roadmap in place, Barry Callebaut rolled out four modules to plant managers and identified process lines for increased efficiencies. “We deployed it one module and one line at a time, with a strong focus on user interface via AVEVA’s InTouch human machine interfaces (HMIs), which was the basis to build our performance module,” says Van Genabet. “We gave operators a dashboard to show operator performance and whether they were winning or not.”
The breakthrough came with a performance analysis on run rates for challenging lines. “So we identified about 10% in some cases more of unknown capacity, not unused, but we just didn't know we had that capacity,” says Van Genabet. “Ten percent is significant because if you can increase capacity on ten lines by 10%, you get an entire new production line for free.”

With MES layer one and two being the company standard, Barry Callebaut implemented this template for its selected pilot sites. Image courtesy of Barry Callebaut
Finding small percentages of line efficiency or equipment optimization can be seen across all sizes and shapes of food manufacturing, including smaller companies. Summer Garden Food Manufacturing, a small food manufacturer, uses Rockwell Automation’s Plex Smart Manufacturing Platform (MES) and the 5300 ControlLogix PLC platform to report downtime directly from the controller. “We're using the PLCs to do all of the reporting (of downtime for the filler machines),” says Jason Morrow, controls technician at Summer Garden Food Manufacturing. “There's no operator interaction with the reporting, eliminating micro downtime on the line.” This new solution eliminates operator interventions and shutting machines down for five minutes at a time.
“Once we have all that micro downtime out of the equation, it should increase production and reduce three to four hours of downtime per shift,” says Morrow.
Understanding “Common Vs. Unique” Requirements for Multi-Site Deployments
Work process-related: Product variety drives different production methods. In the food and beverage industries, for example, a master recipe for a single product can exist as multiple variations as site-specific or line-level recipes reflect packaging configurations, unique needs of local markets and differences in raw-material sources.
Equipment and automation-related: Plant age (older production technologies and equipment), disparate levels of automated versus manual processes, disparate system architectures, etc., are sources of uniqueness.
Often, these differences can be traced back to different vendor partners (EPCs, systems integrators, hardware, software) used at different stages of the plant lifecycle.
Workforce-related: Differences in local culture, regulatory requirements, operating philosophies (like lean), labor market dynamics affecting talent and skills availability, etc., impact the workforce.
Metrics-related: Plants can support the supply chain strategy differently. For example, a "cost factory" making low-margin products might emphasize utilization metrics, whereas a "launch factory" might focus on time and responsiveness. Source: AVEVA Group
Scaling OEE at Carlsberg
Carlsberg Brewery operates 78 facilities across the world, and 28 of these plants recently adopted ThingWorx, an industrial system software platform from PTC. The brewer has 140 brands under its Carlsberg banner, and many of the beer production plants acquired over the years have processing equipment and PLCs from various automation vendors.
Like many large food and beverage companies, the brewer identified a specific business value in deploying a standard monitoring platform across the enterprise: to increase overall equipment effectiveness (OEE) for 28 plants. The Danish brewer adopted the end-to-end system software and its PTC’s Kepware’s OPC data protocol as a way to solve this multi-site data challenge. ThingWorx’s Kepware server allows for proprietary PLC data and other discrete legacy equipment information to be read via OPC UA drivers and fed into ThingWorx, an analytics data platform.
ThingWorx’s value is being able to analyze disparate equipment assets—tanks, pressure sensors, PLCs—and deliver real-time data analytics and reporting for operators and plant managers.
Moreover, Carlsberg wanted real-time performance monitoring so operators could view large digital screens with dashboards on the plant floor. The brewers wanted current setup, performance, assets status and KPIs for specific lines via these dashboards. Key production metrics include estimated completion time for a work order and speed of water consumption. Besides line performance, tablets with apps show downtime analytics for specific machines and propose an explanation in real-time. According to Carlsberg, the operator can then confirm the next actions to take, even from a remote location in the facility.
Carlsberg has been exploring digital solutions for more than a decade. With the addition of ThingWorx, the brewer is now more proactive in root cause analysis for machines and production lines.
“By looking at the historical data, we can determine when a failure might happen and will soon be proactive in scheduling maintenance around that expectation,” says Marco Farina, global OT manager at Carlsberg. “Moving toward these capabilities has helped us see improvements every day, especially since we started to do the reporting and aggregating of all the data worldwide.”
Moreover, the data analytics platform uses Microsoft Azure’s cloud service. Azure can be used in centralized applications, and this integrated Microsoft solution allows Carlsberg to use Microsoft’s Power BI. Power BI allows developers to create Windows-based business apps that flow through enterprise resource planner (ERP) platforms and target corporate management. For Carlsberg, the apps offer dashboard views across multiple plants and contextualize the data for management.
“It’s been very easy to use ThingWorx with Azure to collect new data, process it and create something new,” says Farina. “That’s the benefit of the PTC and Microsoft solution: that you can create something and go from the concept to the rollout to the go-live very, very easily.”

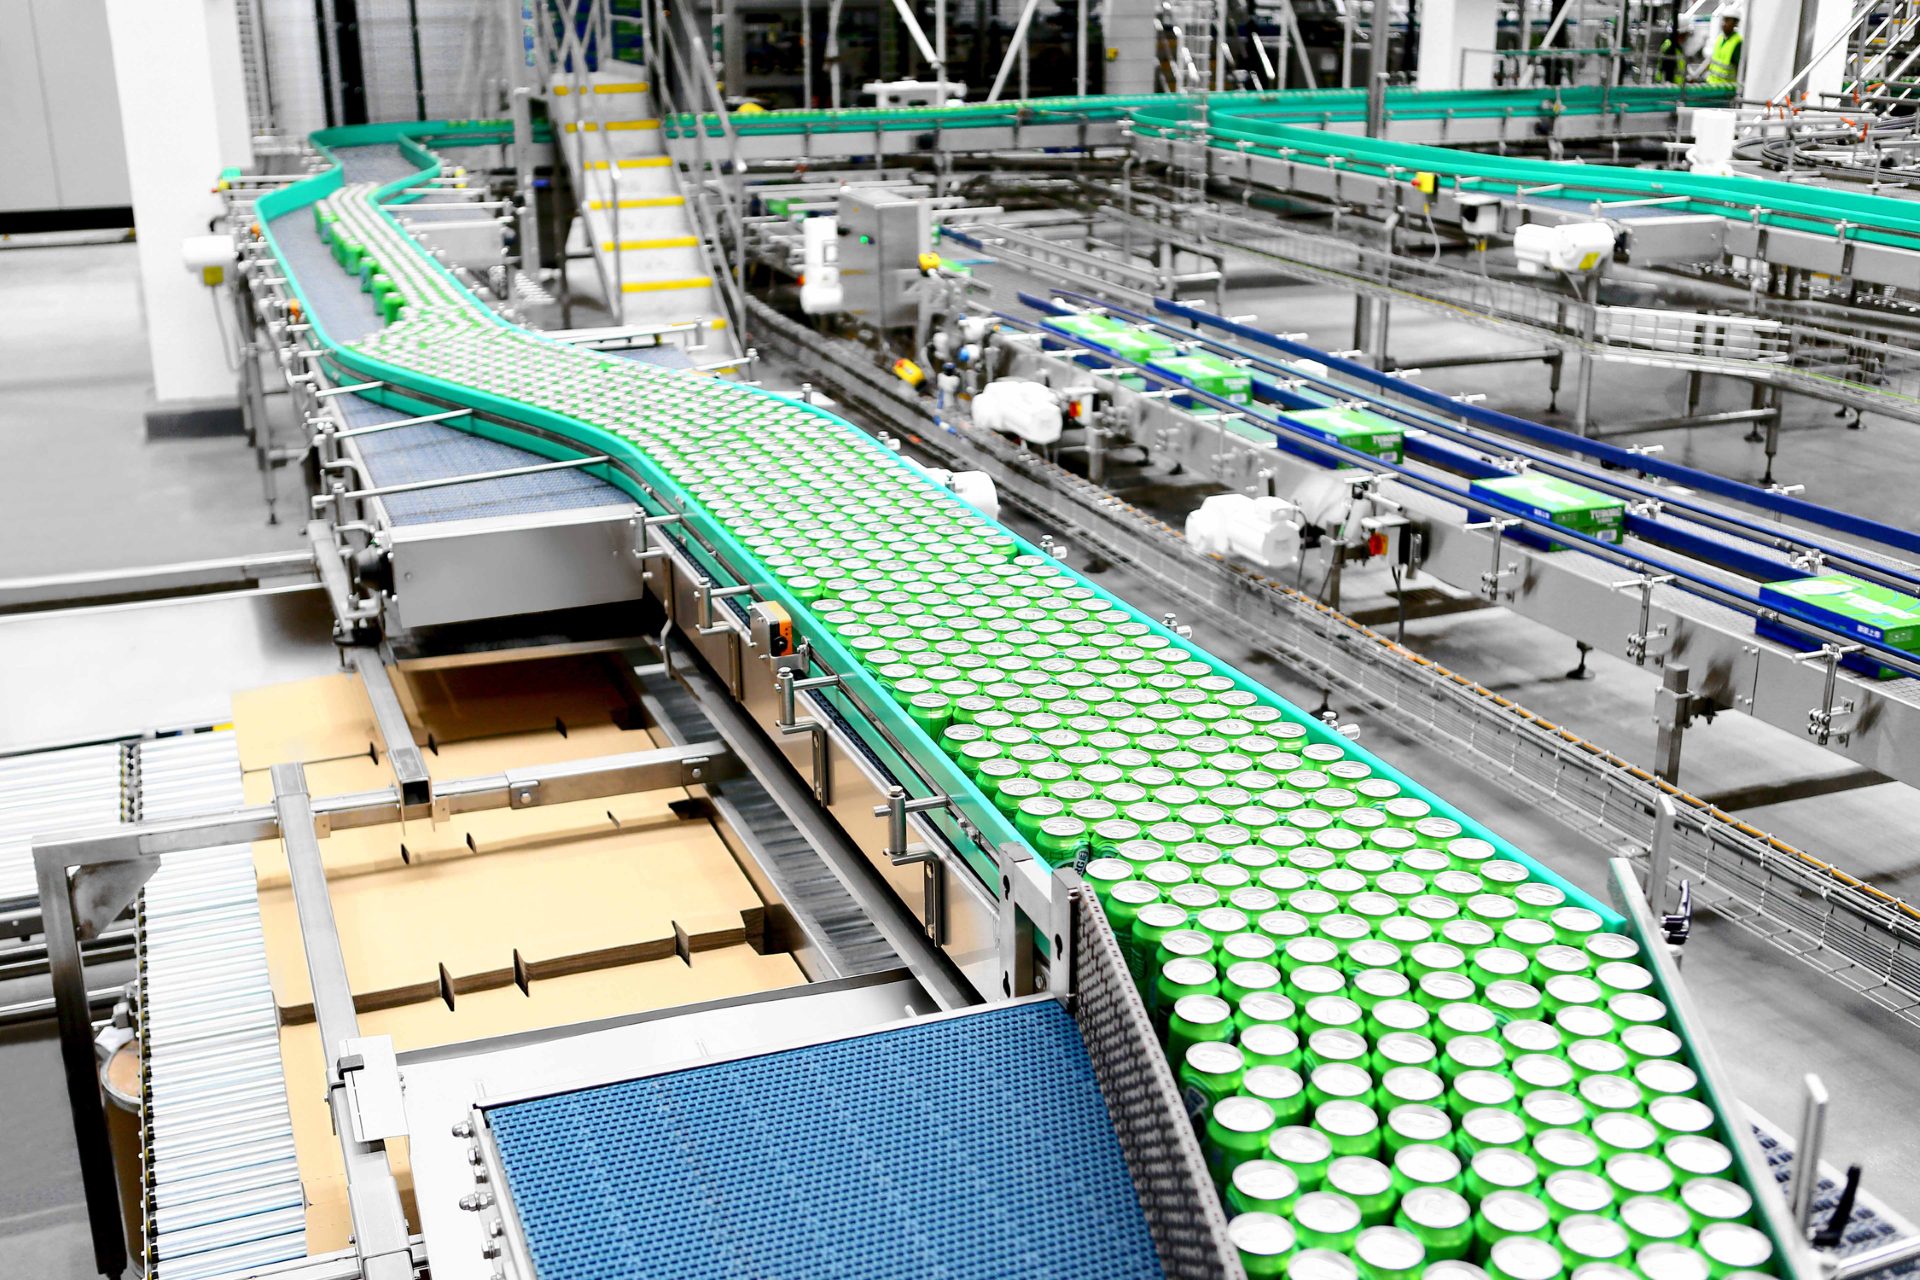
Carlsberg identified overall equipment effectiveness as the key metric for 28 plants and part of its multi-site efficiency initiative. Image courtesy of Carlsberg
Change Management and Workforce Implications
A throughline with these examples is workforce dynamics and change management. Barry Callebaut cited pilot project bottlenecks early on due to a heavy focus on the technology, and not business goals and workforce implications.
“Operators compare the new digital tool with what they did before, and very often that was a paper-based registration (of downtime events), which doesn't take much time to write down your downtime event,” says Van Genabet. With new HMI processes for downtime events, Barry Callebaut refined its design after the first stage of deployment, learning from its earlier iterations.
Operator buy-in is needed, but so is flexible manufacturing. “Once the requirement of the metrics and visualization is generated and standardized, this can be rolled out across multiple sites, though some sites may have established their own 'homebrew' solutions,” says PTC's Brooks. “Therefore change management is needed to ensure the adoption and the realization that the approach creates an enterprise view of production capacity.” FE


